Home Price Growth Update
Home prices have increased far more than apartment rents in the past five years, but home price growth is not without some limits.
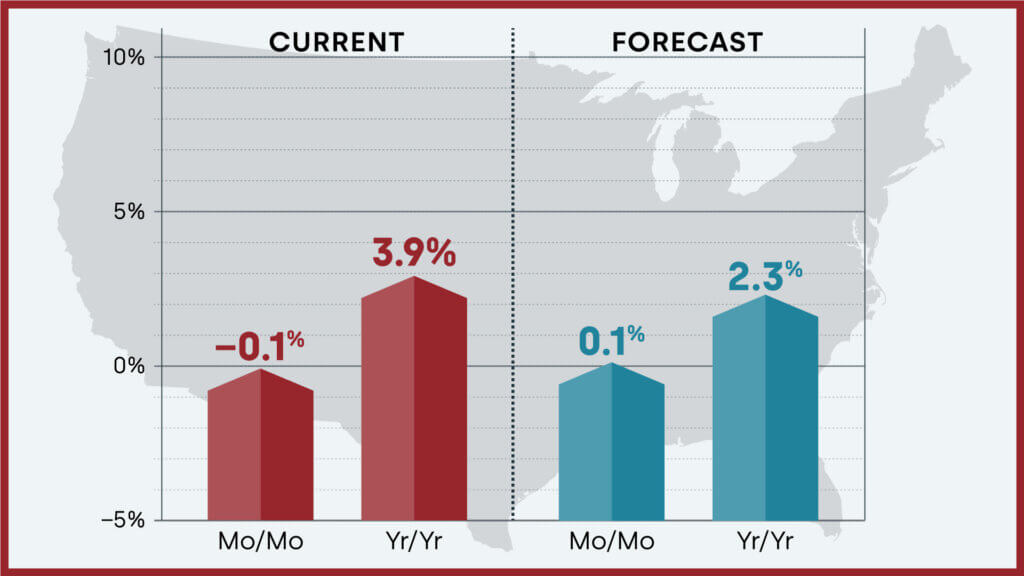
Source – CoreLogic: “U.S. Home Price Growth Reaches Lowest Level in a Year in August”
After talking up the price growth in the single family home market and how it’s such a solid indicator of housing demand in America, I wanted to cover this softening in single family home price growth as a reminder that home prices aren’t in a world of limitless growth. The same kindof subdued uncertainty in the economy is present in the single family home market.
The growth of home prices is weakening slightly. Prices aren’t weakening. Price GROWTH is weakening.

A better look at home prices over time will place this current home price data in context.
- Yearly home price growth peaked in March 2022, at 20.79%. Then, that growth fell month after month until May 2023, when it bottomed out at -0.28% yearly growth, for one month, then it moved into the positive territory, growing to 6.5% in March of this year, and it has dipped down since then.
- “Home price growth moved up to nearly 4% year over year in August, though gains are projected to fall to less than 1% by next spring.” This data isn’t the exact same as the Case Shiller home price index, which is actually linked to CoreLogic as well with the full name (ahem) “The S&P CoreLogic Case-Shiller U.S. National Home Price Index.” This CoreLogic article has the August numbers, and the latest data from Case Logic et al. is from July, and it’s showing 4.95% yearly price growth.
- But essentially, the general trend here, essentially, is that we’re still caught within the ripple effects of the highest home price growth in the history of the S&P CoreLogic Case-Shiller U.S. National Home Price Index, since before the S&P and CoreLogic came on board, back when it was just Case Shiller, home price growth has never been as high as it was in March 2022, at 20.79%
- The previous high point for home price growth was 14.5% in September 2005, and after that, it sank down through the Great Financial Crisis and was negative from March 2007 to April of 2012. Five years!
- The next time home price growth was negative was one single month, that May 2023 point I mentioned earlier.
Source – Marcus & Millichap: “Homebuying Out of Reach for Many Households Despite Lower Debt Costs”
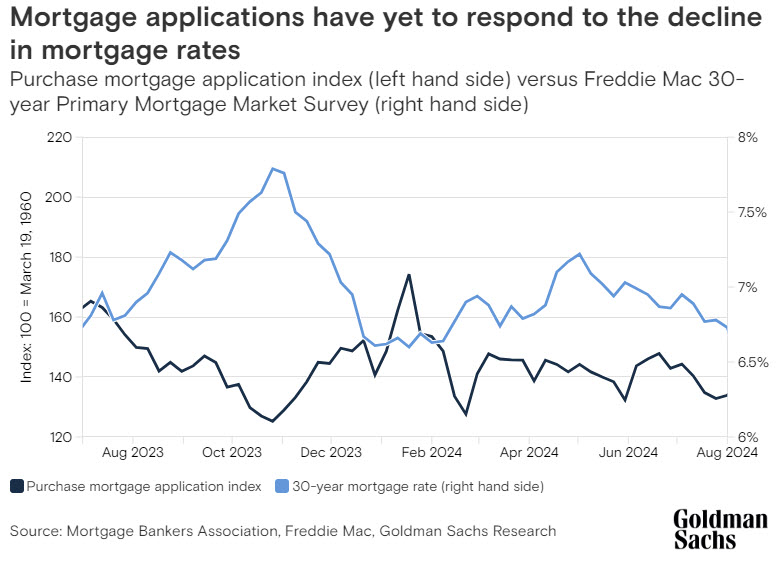
“Mortgage rate plunge fails to stoke buyer demand. Existing home sales decreased by 3.3 percent year over year in August 2024 to an eight-month low. That pullback transpired in the midst of substantial downward movement in the average 30-year fixed-rate mortgage. The gauge plummeted by 60 basis points year over year to 6.5 percent in August and slackened by an additional 40 basis points through mid-September.”
Rates are still fairly high, and they’re nowhere close to where they used to be 2.5 years ago, this research brief calls out “record
Source – Goldman Sachs: “US house prices are forecast to rise more than 4% next year”

I’ve got to tip my hat to Goldman Sachs for the conversational tone of this post on housing and home price growth: “[W]e’re not seeing higher permanent layoffs — at least not yet. The reason we think right now that bad news is good news is that rates are falling because of concerns around employment, and we don’t think those concerns will really affect the housing market without income loss. All you’re really seeing is that the cost of buying, of taking on a mortgage, is coming down. To that end, we’ve already seen substantial improvement in funding costs. Just to frame this, the peak in the cycle saw mortgage rates of about 7.8% in Oct. 2023. Mortgage rates have since fallen all the way back down below 6.5%. We believe we’re well past the peak in mortgage rates, and we think it’s going to be a slow but steady grind lower over the coming years.”