Apartment Demand and Middle-Income Housing Affordability
Source – Cushman & Wakefield: “Unpacking Multifamily Supply Risks and Demand Booms”
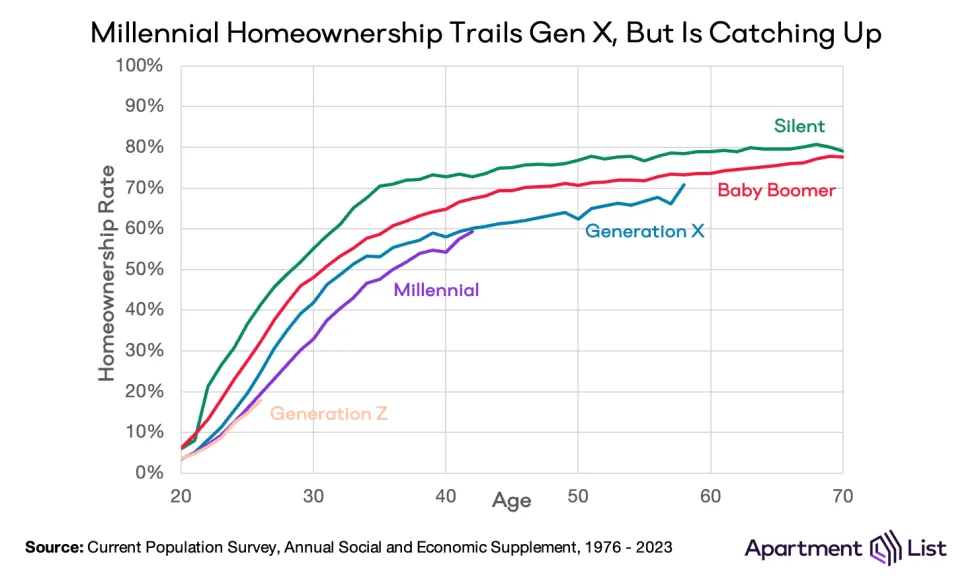
This report from Cushman & Wakefield has a direct connection to a recent report from Apartment List, citing that very same low homeownership rate of Millennials as a demand driver for the multifamily market.
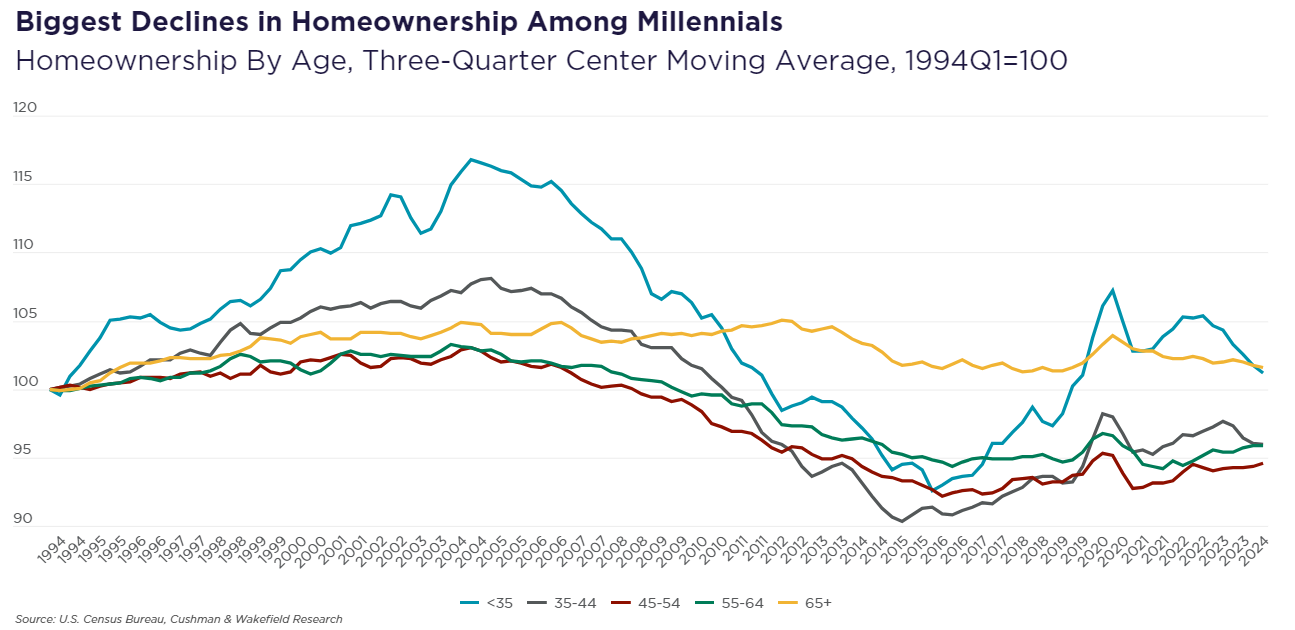
The graph that they have breaks down homeownership rates by age group, and measures how much the homeownership rate has changed since 1994.
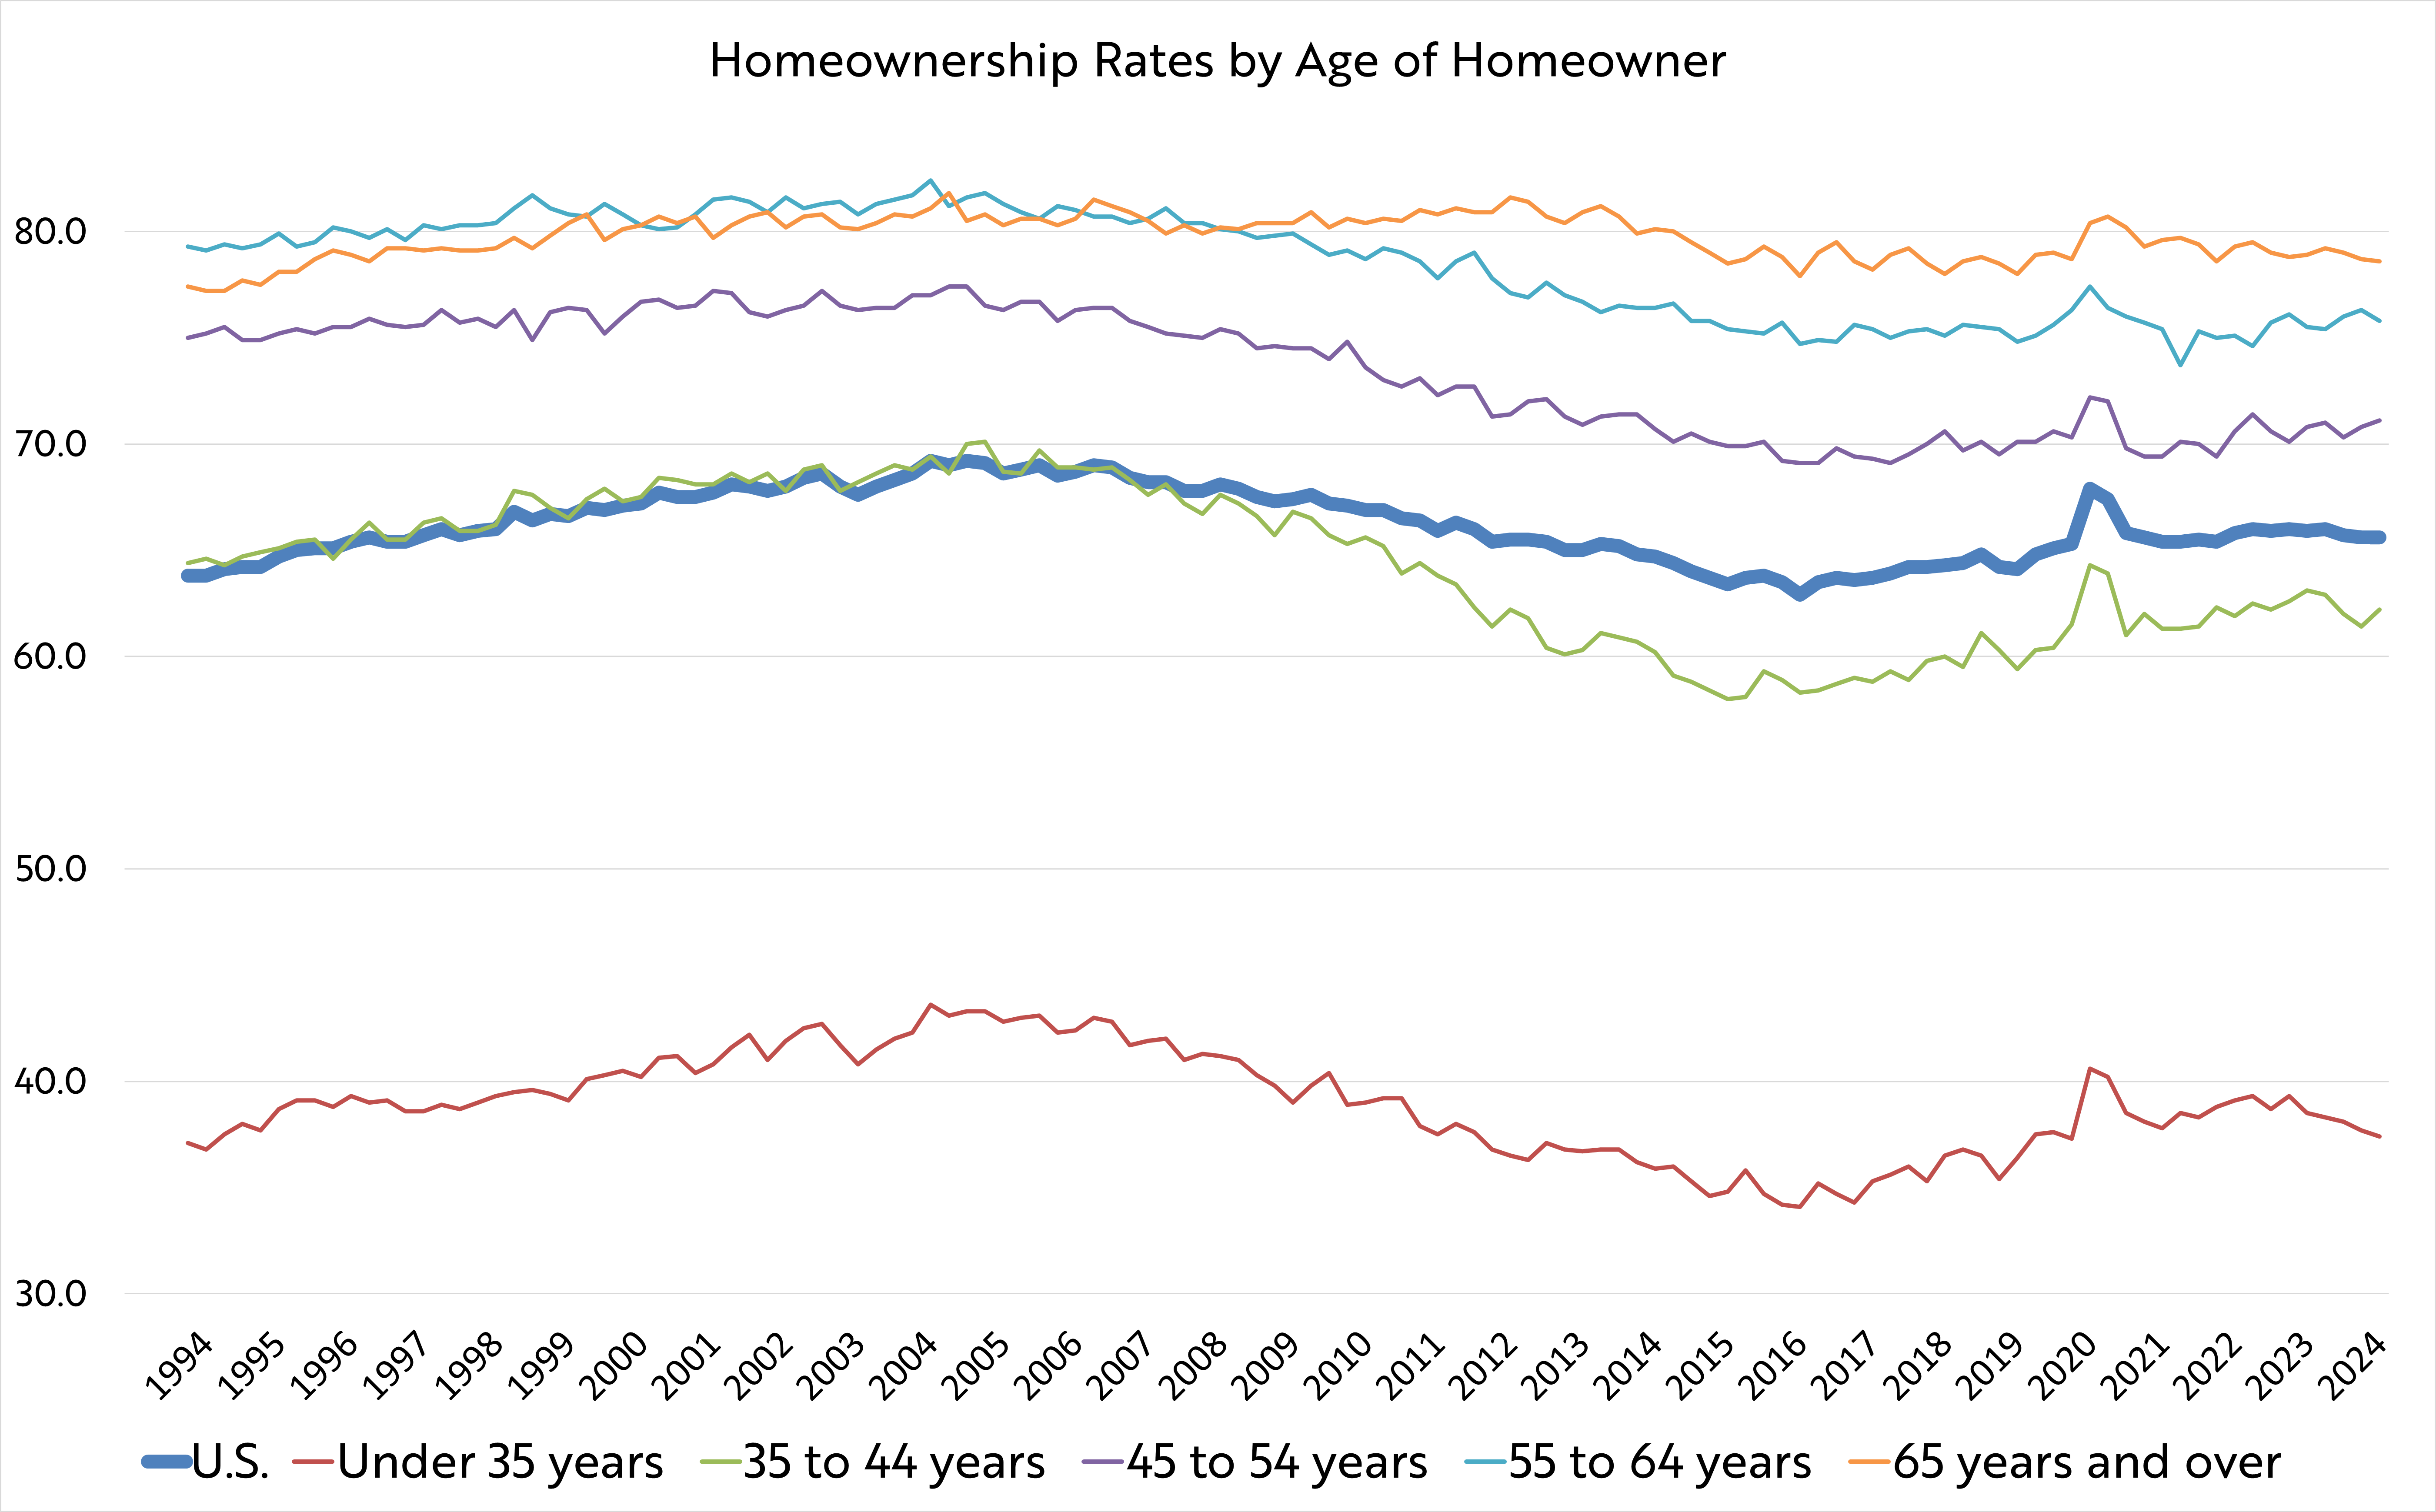
- I went to the source and made my own graph that doesn’t show the change since 1994 and just shows what the rate is each year because the chart in the Cushman & Wakefield report makes the under 35 demographic seem much more active and dramatic, and one of the reasons why is because that group has by far the lowest homeownership rate of all the groups included, so the swings are more exaggerated in that age group compared to the others. But this graph in the Cushman & Wakefield article is really good at showing the relative growth in homeownership of these different age groups.
- But essentially, they’re tracking lower homeownership in all of these groups, specifically pulling out the 35-44 age group and under 35 age group as the ones that have gone down the most in recent years. That being said, these two groups, the under 35 and the 35-44, are the ones that saw the most growth in homeownership, peaking much more sharply in 2020 and again in 2022 before going down.
So with these homeownership trends, you have to kind of fill in the blank when it comes to apartment demand. The logic that we’ve heard in so much reporting on the multifamily market and apartment industry is that when single family home prices are too high, that will push up apartment rents from “would be homeowners.” I’ve used the phrase “would be homeowners” at least a hundred times on the Gray Report, that’s how much we’ve been covering this issue, and to be honest, I have not, as yet seen a study or report or analysis that nails down this relationship between higher home prices and increasing demand for apartments. If someone has already written this report, certainly let me know in the comments, but if this report doesn’t exist, I may have to just write it myself.
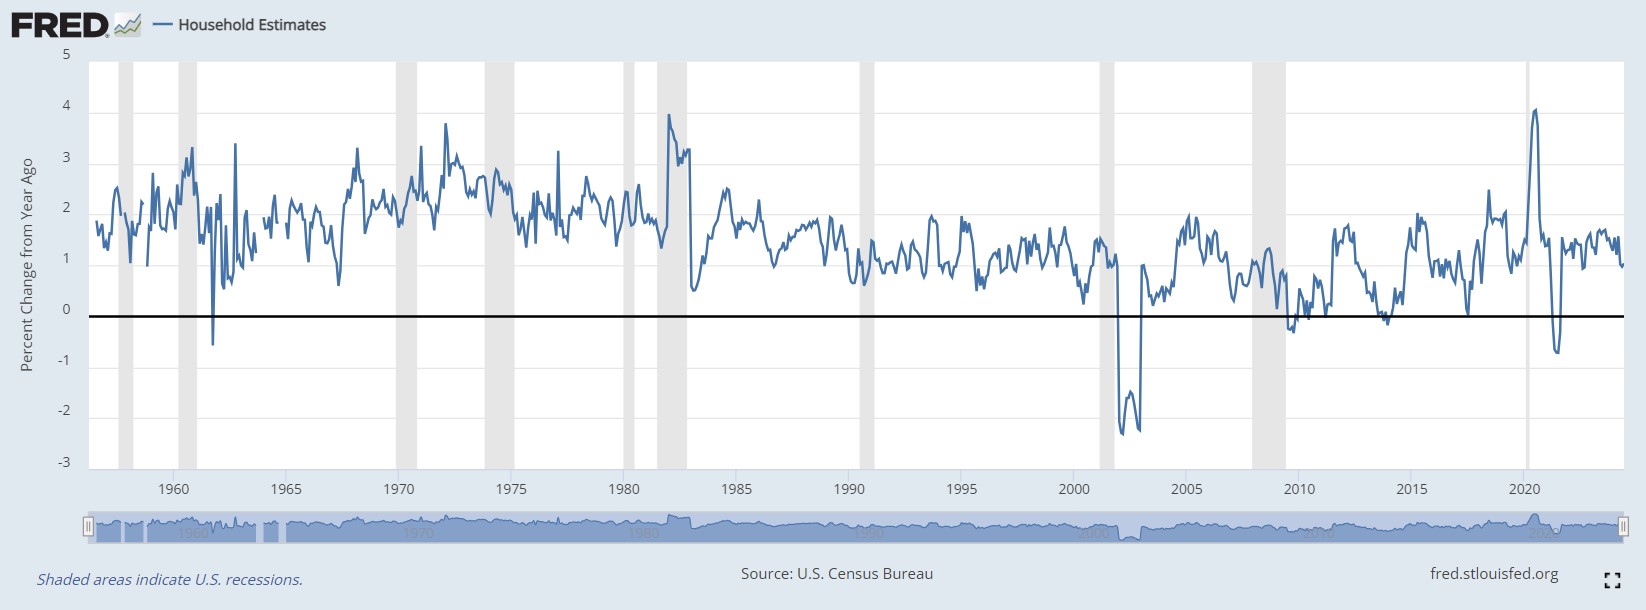
But household growth, that’s a really strong indicator of apartment demand. Along with the phrase “would-be homebuyers,” another phrase we’ve been saying ever since the early days of the Gray Report is “housing demand is housing demand.” This household growth is a combination of apartment households and single family homes and other forms of housing, but it’s a clear positive indicator. The bar graph they have here for household growth gives us a numeric value, but it’s easier to use a line graph that shows the year-over-year change in households, where you can see household formation hovering around 1-2%. It ebbs and flows, but it really stays within that band, and this level of household formation is roughly on the upper bound of the average since 1985. So we’re not like, substantially higher than normal, but we’ve got robust household formation, which does translate to higher apartment demand.
Regionally, apartment demand, Cushman & Wakefield says, is in the South. The SunBelt. And those are the markets where they’ve been building, but, as we have been tracking so closely on the Gray Report, the massive influx of newly-built apartments, that massive wave has crested, but that doesn’t mean the wave is completely gone.
But just to compare the amount of apartments under construction in Q2 2023 versus Q2 2024, like Cushman & Wakefield does in a graph here, virtually all of the cities in the graph have lower construction activity this year compared to last year. A lot of them, construction is cut down by a third, some have close to half as many apartments under construction compared to last year.
This means that apartment supply will not be growing as quickly as it has in the past two years, but moving down the report, Cushman & Wakefield shows how, if you look at units under construction, average annual demand, and excess vacancy, some of these markets have 3 to 4 years of apartment supply, Inland Empire has close to 5 years of apartment supply, but “[i]t’s notable that nearly every market on this year’s list has shifted down from a year ago, shortening the timeline as a result of strong demand formation.”
Source – Harvard Joint Center for Housing Studies: “Affordability Challenges and the Composition of Middle-Income Renters”
This post here is an overview of a much longer, 45-page paper from Alexander Hermann, Whitney Airgood-Obrycki, Nora Cahill, and Peyton Whitney of the Harvard Joint Center for Housing Studies, and upon examining these middle-income housing programs, they conclude that “policies designed for middle-income renters will disproportionately benefit groups [they define as “non-Hispanic white . . . younger, and . . . more likely to be college educated and less likely to have a disability”] and [middle-income housing programs would] systemically reinforce existing racial and socioeconomic inequities.”
As such, they more or less favor a policy approach centered on lower-income groups, given that “low-income renters are much further from achieving a comfortable standard of living than middle-income households.”
They mention that middle-income housing programs would increase housing supply in a way that would create more affordable housing supply for lower-income families down the line, but they don’t miss words here: “It is imperative that existing funding to lower-income housing subsidies is preserved as more attention is called to affordability struggles climbing the income scale”
80% of lower-income renters had cost burdens compared to 33% of middle-income. Middle-income renters, that cost-burden went up 6.3% to get to that 33%, and even though the lower-income renter group, that cost burden only went up 2.5% since 2019 to get to 80%, that 80% is way high, over twice the amount as middle-income households.
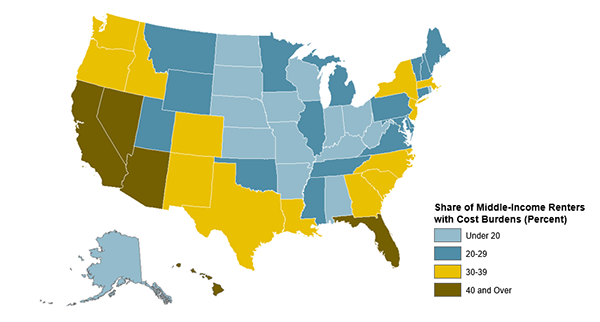
Regionally, we’re looking at the same kind of map that we saw in the Apartment List report on Millennial homeownership. Cooler, bluer colors in the Midwest, warmer colors in the South, Sunbelt, and West regions. Nevada, California, Arizona, and Texas stand out here with over 40% middle-income renters cost-burdened, compared to states like Indiana, Ohio, and Wisconsin with under 20% of middle-income households cost-burdened. Again I ask, is housing so costly right now that cheaper housing could be a draw to low-cost cities in the Midwest? Yeah, it’s not so easy to move somewhere if you can’t find a job there, but hey, there could be more and more people looking for jobs and filtering for Midwestern cities, moving there, and maybe getting a bigger apartment or house than they would have gotten otherwise, or maybe it’s the same size but they’ve got more money to afford other things.
But you can’t just move wherever you want whenever you want to. There are other options out there for assistance to middle-income renters that could involve incentives and subsidies for builders to increase apartment supply. The first episode of Jay Parson’s new podcast “The Rent Roll with Jay Parsons” covers this idea and similar ones about how to increase the capital for middle-income apartment projects, and he really makes a solid case, along with his guest Bob Simpson, for the stability of middle-income housing from an investor perspective with stronger returns and less volatility than shorter-termn value-add plans. The way that it was described, these less flashy deals, maybe they’re like 15 years old or so, they really compare favorably to other projects.
Source – Moody’s Analytics: “American Needs More Affordable Housing, Not Just Class A Inventory”
One key passage gets right into the issue at hand:
“Moody’s CRE data indicates that over the last ~25 years, the share of class A multifamily units in the United States increased by 18 percentage points to just over 50%. Said differently, the share of class BC multifamily units has fallen by 18 percentage points, underscoring how since the turn of the century, developers, on aggregate, have been prioritizing buildings that generally command higher rents.”
So, even though there are more and more of the nicer class A apartments compared to the average or so-so class B and C apartments, class A rents are getting more expensive compared to class B and C apartments.
The author here, Nick Villa, makes a solid case here, and I would expect no less from Moody’s Analytics, in what I’m going to informally call “the Thomas LaSalvia school,” named after the amazing Head of CRE Economics at Moody’s, and Nick Villa here adeptly furthers its sterling reputation in this article, laying out the progressively higher share of class A apartment units in the past 25 years, going from a little over 30% in 1999 to about 50% in 2024, and “extrapolating from the historical data would suggest that the share of class A units is likely to rise.”
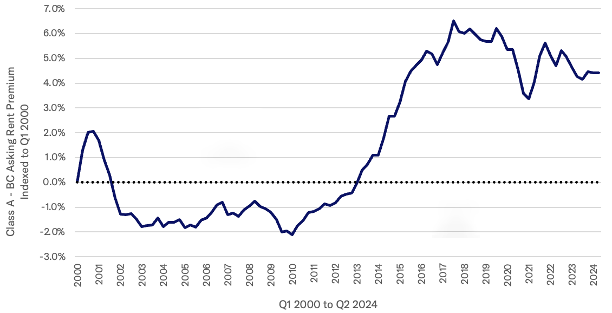
The next part is the confounding and frustrating part: Even though we’ve really ramped up building these nice luxury apartments and created a lot of additional class A apartment supply, it’s actually gotten more expensive to upgrade from a class B/C to a class A in that same time period. In 1999, class A apartments were 41% more expensive than their B/C counterparts. In 2024, class A apartments were 45.4% more expensive. And yeah, 4.4% maybe isn’t too much if we’re talking about 25 years for that gap to form, but the crazy thing for me is that class A apartments gained about 20% of the total share of apartment supply in that time period, and that supply increase did not translate into lower rents.
Nick Villa makes a solid case for how, starting in 2013, developers saw the widening gap between class A and class B/C apartments, and that spurred them to build more class A buildings. Solid logic, and I’d also venture to guess that it’s not much more expensive to build a nice, class A building compared to a class B/C building, so there could be an incentive to build class A apartments even if the rent premium was a little small than it is today.
But that rent premium? What is the cause and effect for that???
Villa writes that “[w]ith a higher proportion of the U.S. population shifting toward the upper end of the income distribution, this could help explain why there has been increased construction activity associated with class A units,” and maybe, maybe I could extend this demographic trend to explain a higher level of demand for nicer A class apartments in such a way that would drive rents higher.
Ultimately, Villa argues for more construction of affordable B/C class apartments, and I agree with the need, but realistically, I think there may have to be some additional incentive for apartment builders to choose a less-profitable B/C class project over an A class one. Often times, the B/C class buildings of today were the A class buildings of 3 or 4 decades ago, but there may be more demand at the B/C level than can be met by that decades-long process.